














Ian Goodridge and Christian Betts of Arcadis examine the latest trends in international construction markets as broadly stronger underlying demand struggles against dented investor confidence and rising costs
01 / Introduction
Global construction markets faced headwinds in 2025, even as the components of recovery fell into place. In many markets, prospects were starting to improve following progressive interest rate cuts. However, multiple factors continued to dent investor confidence, even before the Gulf crisis broke out in February 2026.
Chief among those factors is affordability, which remains the most persistent barrier preventing the conversion of need into effective demand for new construction. This is true across many sectors, but particularly in housing and commercial markets, where land values, construction prices and the cost of finance have made it increasingly difficult to sustain a healthy flow of new projects. Rising prices were common in most regions, with deflation seen only in mainland China and Hong Kong.
In such circumstances, public sector work often offers alternative opportunities for contractors. However, after a string of elections in 2024, many new administrations have taken longer than expected to put ambitious investment plans into action. In the UK, accelerated spending on hospitals and schools is still to feed through to significant output growth, and this is unlikely to happen for one to two more years.
Delivery has remained strongest in the US, where recent data points to a pickup in publicly funded construction, particularly in utilities including power, sewage and waste disposal.
02 / The cost index snapshot
The Arcadis ICC index for 2026 covers 100 locations. The data was collected in the first quarter of 2026. Costs of projects delivered in accordance with local specification standards are compared on the basis of a currency conversion to US dollars.
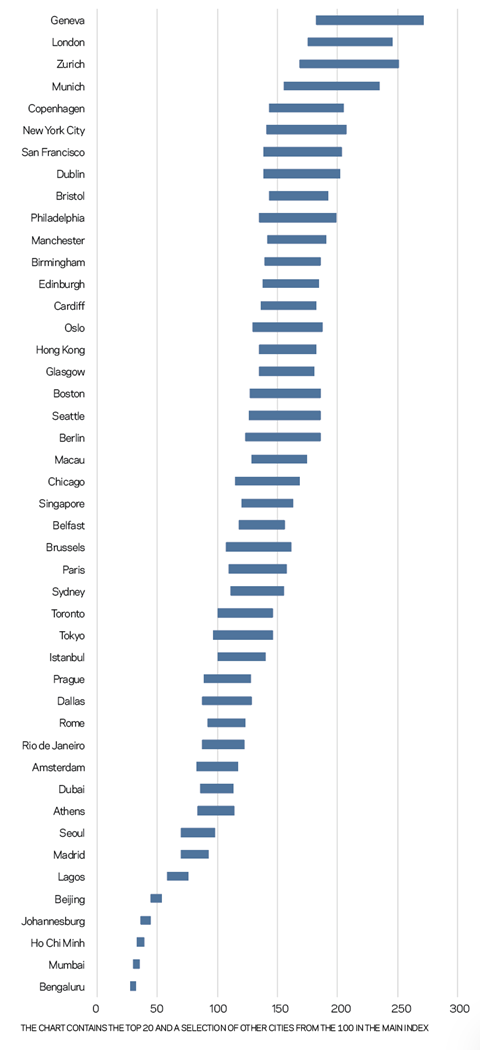
Geneva and London remained atop the index this year. Geneva continued to see relatively high construction inflation at 4% in 2025, while London’s weaker demand, particularly in residential, kept inflation around 1%-2%. Global construction inflation continued to moderate in 2025. Just a few hot spots, such as Turkey and Argentina, saw double-digit inflation while in eastern Europe, relatively high historical inflation subsided to around 2%-4%. By contrast, price pressure remains unusually high in Japan, where 5%-6% cost escalation is anticipated through 2026, and in Australia, where endemic labour shortages and weak productivity continue to hold back industry performance in many cities.
Construction markets in the US also saw rising inflation despite subdued demand, with tariffs likely to be a contributory factor. Most US markets saw inflation of around 4% last year, up from the 2%-3% range in 2024. Some cities, such as Philadelphia and Chicago, saw prices rise 6%. Five US cities remain in the top 20. Elsewhere, some cities saw notable ranking changes due to currency movements, as the US dollar remained steady against the euro and sterling. Oslo is now ranked 15th after a 15% rise in the krona, while Sydney rose 10 places to 35 after a similar movement for the Australian dollar.
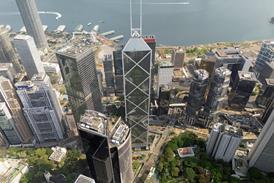
By contrast, Hong Kong has seen the most notable downward movement as the real estate slowdown continued. Having long been one of the world’s most expensive cities, Hong Kong has been on a downward trend since the pandemic, with prices falling by 1%-2% in 2025; this is expected to continue in 2026. With the local currency pegged to the US dollar, Hong Kong’s fall to 16th in the rankings highlights how unusual current deflationary trends in China and Hong Kong are compared with upward price pressure in the UK, Europe and the US.
Aside from the overheated technology and transmission sectors, most construction industries globally are in a moderation phase, with costs under control and resource availability better balanced than for some years. This is unlikely to last beyond 2026. The Gulf conflict has delayed a widely forecast recovery, with strong underlying demand. Some projects are proceeding despite the uncertainty, often because current market conditions allow clients to transfer a disproportionate share of risk to the supply chain. Whatever the outcome of the conflict, this approach is unlikely to be sustainable.
Figure 1: International Construction Costs Index 2026
Indexed to Amsterdam = 100
About the International Construction Costs Index
The Arcadis International Construction Cost Index offers a comparison of building costs across 100 global cities. The report provides regional construction market insights and highlights examples of investment priorities in major cities around the world. This article includes data for 45 cities. The full report, published in July 2026, can be accessed via arcadis.com.
The index is based on a survey of construction costs of 20 building types, based on local specifications and denominated in US dollars to enable comparison. The index compares the costs of delivering a building function in different locations rather than a like-for-like comparison of the costs of a similar type of work.
03 / Regional analysis
Australia
After a subdued 2024, construction output strengthened meaningfully last year, with the sector expanding by over 3.5% in real terms, driven by transport infrastructure, renewable energy investment, housing activity and strong demand for industrial projects. Residential construction was up 8% – its strongest performance since 2016.
Tender price inflation averaged 3.6% across the key Australian cities in 2025 and is currently forecast to be close to 4.5% in 2026, mainly reflecting structural domestic pressures such as labour shortages, low productivity, insolvencies and limited contractor capacity. Insolvencies remain a major pressure point, with data showing a 21% rise in construction firm failures in the year to June 2025.
The combination of these factors is widening the gap between project approval and delivery. Pipelines remain solid, funding is committed and approvals accelerated late in 2025, yet fewer schemes are reaching site. Efforts to resolve this include procurement restructures, resequenced programmes and, in the case of the public sector, clients engaging earlier and setting more predictable pipelines to smooth the shift from planning to construction.
China
Despite strong public, infrastructure and utility investment, China’s construction market contracted by 1.1% in 2025. Aside from some impact from increased US tariffs, it was the longstanding real estate downturn that was the main cause of contraction, with real estate development investment falling by more than 17%. New housing construction starts, for example, declined by over 20%. Residential now accounts for less than 60% of the construction market, down from a pre-pandemic peak of 68%.
Most Chinese cities in the ICC 2026 index saw construction deflation of about 1% in 2025, following a 2%-3% contraction in both 2024 and 2023. Current forecasts suggest construction prices will be flat at best for 2026.
Weak demand coupled with increased competitive pressure has been reflected in negative scores for China’s sentiment in construction metric each month in 2026, including a record low of 48.0 in April. These results are way below the average 54.8 score of the previous five years, pointing to the bottom of the cycle.
Forecasts suggest construction market growth of 1.3% by the end of 2026, with a rebound supported by government financial incentives and loans directed at energy and industrial construction, combined with further major investment in data centres, including new liquid-cooled facilities.
EU
Latest data from Eurostat shows that output in the EU construction market stagnated in 2025, rising by just 0.5% on the previous year as stronger civil engineering work failed to offset weaknesses in some building sectors. Some markets, such as Spain and parts of eastern Europe, did see growth, but this was offset by lower levels of activity in the leading markets of France and Germany, where falling residential activity remained a drag.
Ireland’s construction sector demonstrated resilience last year, amid cost pressures and capacity constraints. Leveraging strong public sector pipelines and sustained housing demand, building and construction investment recorded a very healthy 9% growth in 2025, despite momentum slowing towards the end of the year.
In Germany, while residential and commercial market activity remained weak, the pickup in defence and infrastructure spending was feeding into pre-conflict forecasts of 2.5% growth in the construction market in 2026.
Indeed, the outlook seemed more positive for the whole European construction sector at the start of 2026, with improving confidence among contractors, a rising number of permits for new housing, and extra infrastructure investment all seen as drivers of recovery. However, recent changes to tariff regimes and three months of conflict in the Middle East, combined with the end of the EU Recovery and Resilience Facility (RRF) funding at the end of this year, saw Euroconstruct in June downgrade its forecast for growth in 2026 from 2.4% to 2.0%. Prospects will not have been helped by the European Central Bank raising interest rates recently for the first time since September 2023 to 2.25%, bringing an end to an extended rate-cutting cycle.
US
The US construction market saw stasis or even slight contraction across some sectors in 2025 as the impact of tariffs and general uncertainty rippled through the industry. This trend looks set to continue in 2026, especially in cost-sensitive sectors such as residential, where affordability issues have been exacerbated by rising costs associated with tariffs and energy costs.
By contrast, construction of data centres, power facilities and healthcare projects provides the strongest opportunity for growth. Recent data suggested 76 data centre projects were due to start in the US in the first half of 2026. However, opposition by local populations could mean only half of planned data centre capacity is completed on time, according to Goldman Sachs. This could be a watch-out for data centre projects in other regions too.
US construction markets did see rising inflation in 2025, despite subdued demand, with tariffs a contributory factor. Inflation in most markets in the US was around 4% last year, up from 2%-3% in 2024.
04 / Impact of the Gulf War on construction projects
The Iran war has triggered a significant economic dislocation following the closure of the Strait of Hormuz. Borrowing costs have risen and global growth expectations been downgraded. Even with the cessation of hostilities, longer-term disruption remains possible.
Traffic through the strait accounts for 20% of global crude oil and natural gas consumption. Even as the flow of energy resumes, the risk is of not only higher prices from elevated energy costs, but also the continuing risk of disruptive shortages. At the time of writing, it is planned that the strait should reopen once de-mining operations have been completed.
The International Energy Agency (IEA) scenario for a gradual reopening from Q3 2026 is on track, but oil and gas markets are expected to remain in deficit until at least Q4. Even as trade resumes, disruption is likely to continue through the year.
From a construction perspective, the impacts of the conflict will be felt in four areas:
- Lower growth – leading to reduced investment demand
- Higher inflation – based on direct inputs such as energy costs and indirect factors, including wages
- Higher borrowing costs – mostly government borrowing driven by higher debt levels and fiscal rules
- Lower confidence and decisiveness – influenced by risk appetite and certainty.
Taken together, weaker growth, higher borrowing costs and lower confidence could reduce activity levels. Construction costs may still rise despite softer demand, spare capacity and stronger competition, although some inflation is likely to be absorbed by the supply chain.
Inflationary impact on construction
Construction will be exposed to inflation because many key materials, including steel, aluminium, masonry, glass and cement, are energy-intensive.
Many schemes, especially large infrastructure projects, will also face higher plant and logistics costs. Fuel typically accounts for 15%–20% of the cost of hired and operated mobile plant.
The rate of inflation pass-through will depend on several factors:
- Product complexity – more complex assemblies and equipment include a greater share of labour and value-added inputs that are less exposed to inflation.
- Competition and pricing power – sectors with weak demand and spare capacity, such as residential, will see more inflation absorbed by the supply chain.
- Procurement strategy and risk transfer – inflation risk sharing should reduce the level of risk premium included in bids.
- Project timing – lead-in periods and programme duration may affect suppliers’ pricing strategies.
Arcadis has modelled the potential impact of additional inflation on a range of UK building projects, including offices and multi-family residential, considering plant, transport, materials and higher energy costs.
IMF and OECD analysis suggests the UK is more exposed to energy-related inflation because of its reliance on imported oil and gas. Countries with more self-reliant energy systems, including Australia, France and the US, are likely to be less exposed, although higher fuel costs will still feed through.
The assessment is for additional inflation and does not consider normal background increases associated with wages and other factors.
The model enables scenario testing at different levels of energy price inflation. One set of results is shown in table 1.
Table 1: Indicative inflation scenarios related to energy price rises
| Scenario: | Commercial office | High-density residential | |
|---|---|---|---|
| Price increase relative to Feb 2026 | Brent crude equivalent (US$ bbl) | % increase on base cost | % increase on base cost |
| 50% increase | 105 | 4.0 | 3.0 |
| 25% increase | 88 | 2.5 | 1.5 |
| 10% increase | 77 | 1.5 | 0.5 |
Indicative building specification
- Office: Mid-rise with piled substructure, composite steel, post-tensioned frame, PCC panel external wall cladding with aluminium windows, and part-glazed roof. MEP including A/C. Fit-out to cat A. External works.
- Residential: High-density, multi-family homes with piled substructure and shared basement. Concrete frame, PCC wall cladding, aluminium windows. MEP with centralised air-source heat pumps. Fixed furniture. Limited external works.
05 / Currency trends
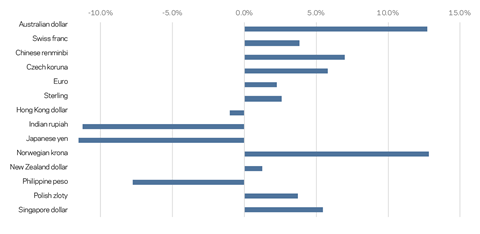
The impact of currency movements against the US dollar has again been influential in the ICC rankings. A 15% rise in the Norwegian krona saw Oslo move up 10 places to 15th, while Sydney saw a similar jump to 35 after a comparable currency movement.
The chart plots the movement of a range of currencies relative to the US dollar. In the 13 months to the end of May 2026, the Chinese renminbi appreciated by 7.5%, the Swiss franc by 4%, and sterling and the euro by about 2.5%. In contrast, the Japanese yen and the Indian rupiah both fell by over 10%. Because movements between the US dollar, the euro and sterling have been quite limited, there are relatively few big movements in the upper sections of the ICC, where most cities are in these regions.
Figure 3: Currency movement versus US dollar, April 2025 to May 2026 (%)
06 / Commodities and energy prices
Even before the Gulf crisis, energy prices were on an upward trend. International Energy Agency (IEA) data shows average wholesale electricity prices in 2025 rose year-on-year in many regions and countries, including Europe and the US, following declines in 2024. While electricity prices for energy-intensive industries remained broadly stable in 2025 against the previous year, regional differences persist. After two years of decline since their 2022 peak, prices for energy-intensive industries in the EU remained elevated in 2025 and continued to be on average about double those in the US and more than 50% higher than in China and India, adding to competitive pressure for European firms.
The World Bank reports that total global gas consumption rose by just 0.8% (35 billion m3) in 2025 – roughly one-third of the previous year’s increase – amid weak demand in the Asia-Pacific, Eurasia and North America. Since war broke out in the Middle East, 2026 gas consumption is now expected to remain flat and could fall if Asian countries continue energy-cutting programmes.
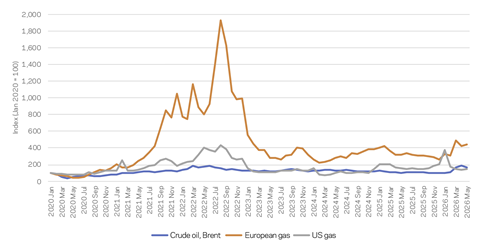
In terms of prices, figure 3 highlights the 60% surge in European natural gas prices in March 2026 due to severe supply disruptions in the Middle East and intensified global competition for liquefied natural gas (LNG). It followed a spike in US natural gas prices in December 2025 and January 2026 due to a “perfect storm” of extreme winter weather, production constraints, and rising global LNG export demand. However, for European gas in particular, prices were nowhere near the highs seen during the early phase of the Ukraine conflict.
Prices for Brent crude spiked sharply after the start of the war in the Middle East, peaking at nearly US$120/bbl, but have since fallen back as the conflict de‑escalated and at the time of writing are just 8% above levels at the end of February. Nonetheless, the conflict has seen countries using up their oil reserves, resulting in stocks in OECD countries falling to their lowest level since 1990 according to the IEA. Even if the June 2026 peace deal holds, Morgan Stanley recently suggested only 50% of the Gulf’s oil and gas production will return by September and 80% by December, meaning global stocks will remain under pressure for months yet.
Meanwhile, the need to refill LNG gas inventories in Europe and the Asia-Pacific will increase consumption in H2 2026 and will see Europe’s LNG benchmark price surge about 25% in 2026, according to updates from the World Bank. This is assuming market disruptions end imminently, with Middle Eastern LNG exports resuming over the next few months and with no further damage to infrastructure. The European benchmark price is then expected to fall by around 20% in 2027, as disruptions ease.
Figure 3: Energy commodity price indices, 2020 to 2026
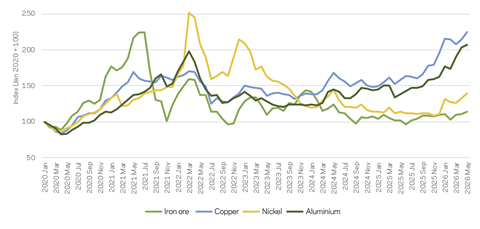
In terms of metals, the World Bank forecasted in June that aluminium and copper prices are both expected to hit record annual highs in 2026, each rising by about 20%, supported by resilient demand and persistent supply constraints.
Disruptions linked to the conflict in the Middle East, operational setbacks, and policy-driven output limits in major producing countries have raised concerns about near-term supply shortfalls. Aluminium has been particularly affected, given the Middle East accounts for about 7% of aluminium seaborne trade. Copper supply growth has also been constrained by disruptions at major mines, including Indonesia’s Grasberg mine, where output is expected to recover only gradually through late 2027.
Figure 4: Metals commodity price indices, 2020 to 2026
07 / Conclusions
The recovery in construction markets that appeared to be on the horizon in 2025 has failed to materialise, with affordability being a key factor across many sectors. In 2026, while unmet need is everywhere, supply chain capacity is not.
At the moment, clients face uncertainty triggered by the Gulf conflict, with potential implications for inflation and supply chain disruption. In such circumstances, the natural tendency is to focus on the problem at hand: fix viability, lock down risk and start to build. But clients also need to position for recovery – for a time when demand does return and being the client of choice will really matter. Thinking ahead and refining plans to beat the market will be key to success.


No comments yet